Introduction to R
29/06/2023

Introduction
For the last three years, I have been teaching undergraduates and masters students to use R. Predominantly as part of a second year statistics module for Ecology, Evolution, and Conservation courses at a UK university. This statistics course naturally blends into other modules and will ultimately form the basis of any third year dissertation the students undertake. Much of this teaching is extremely fulfilling, guiding students through difficult problems, building their confidence, and, yes, pointing out a few unclosed brackets. But there often remains a lingering hatred for R among undergraduates, and come to think of it several PhD students I know. Students who have never quite gotten over being told they shouldn’t use excel any more. This introduction is for those students. It is my attempt to start the slate over again and introduce R fresh, and also start any new students looking at getting into R the best possible path forward.
The main sections of this document cover what R is, why we use R, the basics of using R, and finally the best practise for learning R. There are examples of code within this introduction, but no coding is required. It aims to set users up with the best practices before they set out to write their first lines of code.
What is R?
R is a tool for manipulating, analysing, and plotting data. It is mainly thought of as a programming language such as Java or C++. What this means is R is a way of writing down instructions to tell a computer to do a task. The same way you can use English to tell someone how to bake a cake, you can use R to tell a computer to conduct a statistical test or plot a histogram. R is also an “environment” which means it contains where the computer takes, reads, carries out, and stores the output of any instructions we give it. Everything R does is contained within itself.
Why use R?
Why is this useful? Well firstly and most importantly it’s reliable. Now several undergraduates who have used R before might be screaming at the idea that I’ve just called R reliable. But what I mean by reliable is that if you tell R to do something, it will always always carry out that task in exactly the same way. Wrote some code in June 2012 for calculating the number of elephants in a safari park based on camera trap footage, R will run that code and tell you the exact same number of elephants each time, giving you the same answer today as it did 10 years ago. You can also take that same code, plug in a new data set of camera footage and R will calculate the number of elephants in the exact same way. This is incredibly important for the scientific process. Allowing others to understand and recreate your analysis benefits everyone. It also speeds up the process of analysing data that you’ve previously worked on.
However, this rigidity comes at a cost. R will carry out and complete “incorrect” instructions as well. Normally, this will produce an error. For example if you try to add 5 the word “falafel”.
5 + "falafel"## Error in 5 + "falafel": non-numeric argument to binary operatorBut sometimes, mistakes are made that aren’t outright errors. R can still carry out the instructions you’ve given it but they aren’t the instructions you thought you’d written.
For example, you have an experiment that has five lizards each in an box labelled “1” to “5”. You also have the lizards’ lengths, but the measurements are in inches not cm. As such you go to R and tell it to times all of the length data by 2.54.
#Names of lizard
lizard.name <- c(1, 2, 3, 4, 5)
#length of lizards
lizard.length <- c(12, 15, 13, 15, 11)
#Converting lizard length from inches to cm
lizard.name * 2.54
## [1] 2.54 5.08 7.62 10.16 12.70A quick look at this output would tell us we’ve done something wrong (you’re pretty sure you didn’t have a lizard that was 2.54 cm long), but because R didn’t produce an outright error it can be easy to miss. We might not get an error or a “hey that looks weird” output until a few more lines of code have been run. This is where most/all frustrations from using R comes from - incorrect code. Can you spot what the above line of code did wrong?
We multiplied the lizards number label by 2.54 instead of the length data.
If R has outputted something which isn’t right, or throws out an error saying it can’t carry out a specific instruction, it is not because R has chosen the wrong set of default parameters or guessed what you’re trying to do and relabelled your data accordingly (which excel will do constantly). It is because the instructions, the code you wrote, do not instruct R to do the task you want it to do.
This is the benefit of writing code to analyze your data, instead of using a programme based on clicking around the user interface. Once you’ve written a section of code to conduct a task you will never have to rewrite that section of code again. And because R is the most widely used coding language for statistics it has tonnes or support. You will be hard pressed to find an R error that someone hasn’t previously submitted to an internet forum.
The Basics
R Studio
Nearly everyone who learns R nowadays uses R studio. R studio is a programme designed to make using R easier. You can use R without it, but this consists of typing in code to a literal black box and is difficult to see and learn from mistakes. R studio, allows you to write and edit code as you would an essay in word, check the code is working, and see and compare outputs more easily.
This is what it looks like.
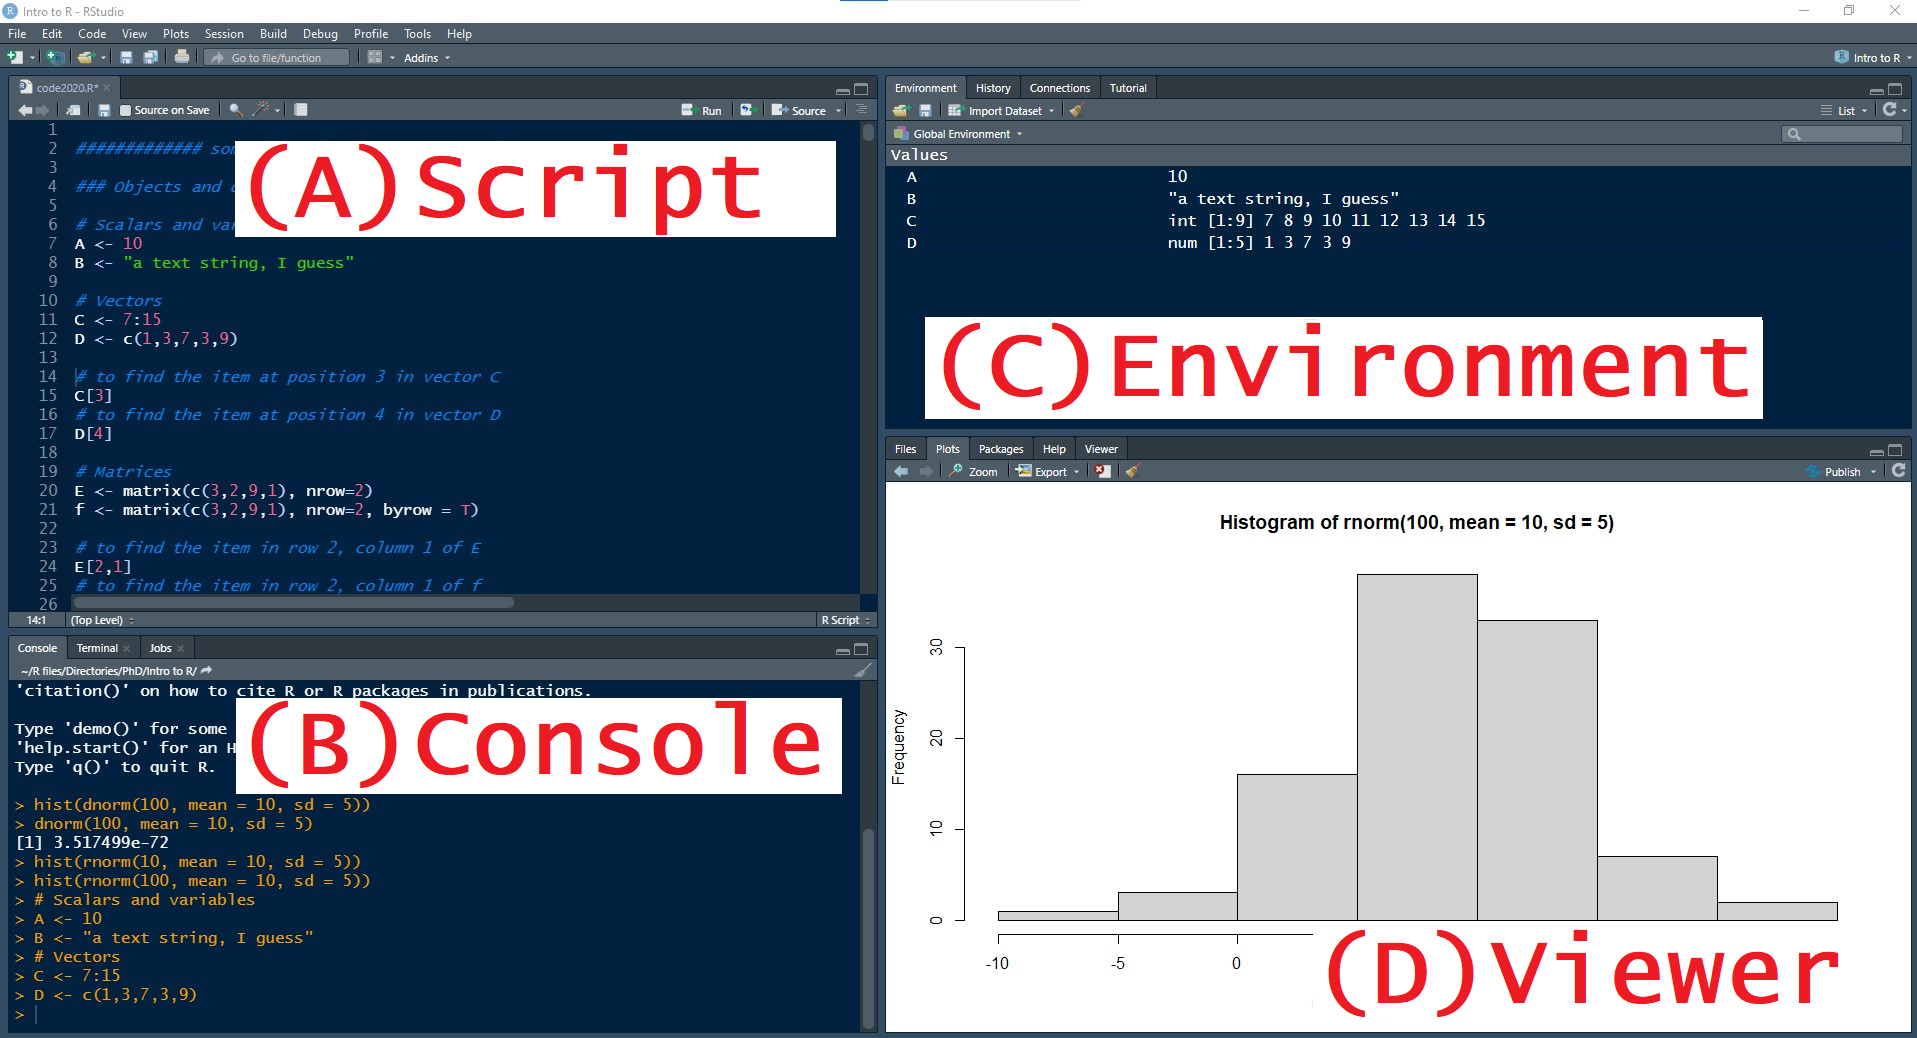
It is split into four main windows; your script, the console, the environment, and a viewer.
Working in R you will spend 99% of your time moving between these four windows. In fact if you are doing something in an R studio that isn’t in these four windows you’re probably doing something dodgy.
The first window in the top left hand side of the screen contains your R script, this is a text file designated by having the file extension “.R” after it. Think of this as a word document, a place to write, edit, inspect, and save your code before you tell R to actually do anything. R scripts can be short or they can be many thousands of lines long. But importantly anything you write into the script is not immediately read and used by R.
The second window sits below your script and is known as the console. This is where the actual work R does gets done. Code that is entered into the console is used by R. This can be done manually, but it is a lot easier and clearer to write your code as a script and then send that code to the console once you are happy and sure what you’ve written is correct. This is done by highlighting a section of your script and clicking the “run” button in the top right-hand side of the script window (or pressing the keyboard shortcut “ctrl + enter” or “command + enter” if you’re on a mac). The console is also where any answers to calculations or results from any statistical tests we’ve asked to be undertaken are printed out.
Simple code often just runs a calculation and spits the answer straight back at you. For example.
6 * 7## [1] 42But soon we begin to need to save and store large or complex sets of information. Information that would be helpful if R stored under a simple easy to use name, rather than us having to type it out manually each time. Here is where the environment comes in. The environment window allows you to look and see what is stored within R at that current moment, these are called “objects”. It also give you a little bit of information about each object stored. New objects are saved in R using the “assign” symbols <-. Meaning we can store information in R by writing the name of the object we’d like to make and then writing what that object should contain. For instances,
bonfire.night <- "5th November"will make an object called “bonfire.night” and have that object contain the information “5th November”. In order to get R to recall the information we have stored within the environment we just need to type in the name of the desired object.
bonfire.night ## [1] "5th November"The R environment can be saved from session to session, meaning you don’t have to read in all your lines of code and recreate all your objects over and over again. However, this can get messy and leads to vital code being lost or misplaced. In general you should have your R environment empty at the start of every session. You can do this by pressing the little symbol of a sweeping brush at the top of the environment window.
Finally, the last window contains a viewing window for output that isn’t text. e.g. graphics. Any plots that R produces will be displayed here. Sometimes this window is used to browse help sheets or files, but its usual function is for looking at figures.
Have this way of moving through R studio built into how you work in R. Write code in the script, send that code to the console, check the environment to see your objects have been created and stored, and view any figure.
Types of data in R
The most common errors produced by undergraduates in R, apart from unclosed brackets, is storing information correctly. Its useful to remember that computers are stupid and can’t understand context. Information stored and used by R has to be assigned a data type. Essentially you have to tell R what type of data it is dealing with. Feeding R a set of data that is labelled incorrectly will very quickly cause issues. There are five main data types: numeric, integer, factor, character, and logical. I know where getting technical here but bear with me.
- Numeric - Numeric data is you basic number data. Think length of dragonfly, speed of cockroach, or time drinking at watering hole. It can be any values as long as its a number.
- Integer - Integers are numbers but they have to be whole, no decimal places. Think number of cows in a field or successful fledglings from a nest.
- Factor - Information should be provided as a factor if it can be stored in discrete packages. This could be experimental treatment, species of animal, or type of food eaten.
- Character - Character data is used for information that is just text written about that specific data point. It could be the ID code for a tissue sample or the name of a person who filled out a survey. It is crucial to differentiate between character data and factor data when the information presented cannot be stored into discrete units. For example, you may have five people called “Oliver” fill out a survey, but you should not group all the Olivers together in the same way you would group everyone who said their occupation was “teacher”.
- Logical - Logical data is simply binary “True” or “False” data.
Notice how in the lizard example above, the error came about in part because we had the names of the lizards stored as a numeric rather than a character or factor. Getting to know these five different data types and making sure your data is assigned the right data type will go a long way to reducing errors in R.
Learning R for the first time
Learning R is not quick. It isn’t always intuitive and is quite often thinking “I’ve seen that error before”. However, there are a few small changes that you can make that will greatly speed up the process. A lot of these fall under the banner of good coding practice, but quite often these are developed later after they’ve been using R for a while. But starting them now will set you up which the best possible chance of learning R quickly and painlessly.
1) Save your code
Save and annotate everything your produce. Quite often I see undergraduates with a R script called untitled_4.R containing every piece of code they’ve ever written, jumbled together in a random order. Using R quite often uses the same lines of code over and over again. Take the time honoured classic.
df <- read.table("my_data_file.csv", header = T, sep = ",")Don’t worry you don’t need to understand that. What’s important is that you know that this line of code opens and reads a file called “my_data_file.csv” and stores it as an table in R call “df”. Given that nearly every piece of analysis conducted in R will start with reading in a data table from a file, this is an extremely important piece of code to have stored and ready to look up if you forget it. As you learn R, store everything you write in a safe and ordered manner. For example you may end up with a list of files like this
- Lesson 1 - Reading in data frames.R
- Lesson 2 - Converting between data types.R
- Lesson 3 - T tests.R
Having your own resource bank of these help sheets will be a massive help a year down the line, when you trying to remember how to conduct an ANOVA for your 3rd year Evolution module.
2) Write linear code
R works by being fed instructions one after another. This means the order in which those instructions are given matter. For example, you need to divide your measurements of ant antenna by 10 to convert them from mm to cm. So you write the following lines of code.
#Creating an object called ant length
ant.length <- c(4 ,6 ,4 ,5 ,7)
#Dividing ant lengths by 10 to convert from mm to cm
ant.length <- ant.length / 10
#Display final calculations
ant.length
## [1] 0.4 0.6 0.4 0.5 0.7But afterwards you discover that your measuring callipers weren’t zeroed correctly and you need to minus 2 mm of all your antenna. So you add the additional line of code.
ant.length <- ant.length - 2
ant.length
## [1] -1.6 -1.4 -1.6 -1.5 -1.3As you can see, this hasn’t given taken 2 mm away from the original data, its taken 2 cm off the ant.length object as it was stored within the environment. We need to write the code as follows.
#Creating an object called ant length
ant.length <- c(4 ,6 ,4 ,5 ,7)
#Minus 2 mm due to calliper error
ant.length <- ant.length - 2
#Dividing ant lengths by 10 to convert from mm to cm
ant.length <- ant.length / 10
#Display final calculations
ant.length
## [1] 0.2 0.4 0.2 0.3 0.5Much more complex and difficult to untangle scenarios can arise very rapidly while trying to fix code. You may not always write your finial piece of code in order start to finish, but you should make sure whenever you take a break or save your work that you have reordered you code so that it is capable of running from start to finish.
3) Litter your code with notes
When writing R scripts you can use the # symbol to
denote lines of code that aren’t meant to read by the computer. This is
helpful because as you can see above it lets you annotate your code. The
very best code you can write will have a # between every
line of code.
#Fizz buzz
#Game if number is divisible my 3 say Fizz, if divisible by 5 say Buzz, if divisible by both 3 and 5 say Fizz buzz

#Assigns the number 3 to the the object "x"
x <- 3
#Assigns the number 5 to the the object "x"
y <- 5
#Assigns the word "Fizz to the object k
k <- "Fizz"
#Assigns the word "Buzz to the object z
z <- "Buzz"

#Starts a for loop using the letter "i" that starts at 1, increases by 1 after each iteration, until it reaches 15.
for(i in 1:15){
  #Asks if i is divisible by x and y, if  so prints k and z
  if(i%%x == "0" & i%%y == "0") print(paste(k,z))
  #If not, asks if i is divisible by x, and if  so prints k.
  else{ if(i%%x == "0") print(k)
    #If not, asks if i is divisible by y, and if so prints z.
    else{ if(i%%y == "0") print(z)
      #If none of these statements are true prints i.
      else print(i)}
  }
}
## [1] 1
## [1] 2
## [1] "Fizz"
## [1] 4
## [1] "Buzz"
## [1] "Fizz"
## [1] 7
## [1] 8
## [1] "Fizz"
## [1] "Buzz"
## [1] 11
## [1] "Fizz"
## [1] 13
## [1] 14
## [1] "Fizz Buzz"Now that may look horrible and complicated and involve lots of symbols that we haven’t yet (and won’t) touch on. But hopefully, you will be able to discern what each line of code is actually doing. This is incredibly important when learning R, you’ll be surprised how complicated and opaque even simple lines of code can look even the day after you wrote them.
4) Rarely copy and paste code from worksheets
If this document went further and started to go through coding tasks, I would make a point of making it so each example of code could not be copied and pasted. It would be stored as a picture. Why? Because coding is tricky and tiny small errors can cause issues. Learning to use R involves being able to pick up on these errors and correct them. And that’s not something you can do by copy and pasting example code. If you are presented with a new section of code, manually type that code out yourself. Learn and notice what each bracket and comma does. You will have to write your own code at some point and learning to pick up spelling mistakes or syntax errors is a big part of that. Typing out all your own code, right from the start, speed that process up.
Starting out learning R with these rules will give you the best shot at building up your knowledge quickly and easily.
End
I hope this introduction to R has given you a rough understanding of what using R is like, how best to approach using R, and some tips for getting the most out of learning R. If you’d like to explore more I can recommend YaRrr- a pirates guide to R.
Bushra Abu-helil, also shared the Harvard R course and the edx course.
Also for women there is R-ladies a community of female coders aiming to make the world of R more inclusive
Feedback from students and teachers is most welcome, you can find my contact details on the Durham Conservation Ecology Groups’ webpage..